
Predicting the 2017-2018 NBA Playoffs using The Pythagorean Winning Percentage Equation
- Khai LAI

- Apr 24, 2018
- 5 min read
Updated: Dec 8, 2018
The playoff is here and so far, and there has been a lot of surprise so far in the first round. Lebron’s Cavaliers is struggling, the Sixers lead by Ben Simmons and Joel Embidd cruising to the Second Round after their marvelous victory over the Heats, and the Utah Jazz- led by Rookie of the Year candidate Donovan Mitchell- on the verge of closing out the series against a stars-stacked Oklahoma City Thunder.
With that in mind, I was really curious of how this year’s playoff is going to play out. Thus, I propose a rather simple model to predict the outcome of the playoff. By using the Pythagorean Win-Share Equation, we could easily deduce out the outcome of different series and determine the potential champion this year!
Method
The Pythagorean Winning Percentage, as described by NBAstuffer , is a “method that gives an expected winning percentage using the ratio of a team’s wins and losses related to the number of points it scored and allowed [in those past games]”. The equation goes like this:
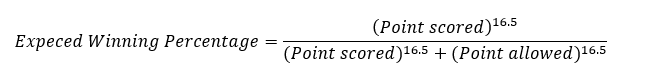
Note that the exponent varies depending on different sources, ranging from Daryl Morey’s 13.91 to John Hollinger’s 16.5[1].
Using this new ratio/percentage, one could multiply it by the number of games (82 in regular series and 7 in a playoff series) to deduce the expected number of wins.

To verify the accuracy of this Pythagorean expectation, I ran some data analysis in Microsoft Excel and compare the expected wins of all 30 NBA teams this season, compare it to their actual winnings, and compute the R-value (coefficient of correlation) to determine the accuracy.
The embedded Excel Spreadsheet next page contains data regarding all 30 NBA teams' average points scored, average allowed, points scored (gathered from NBA Advanced Team Stats Database[2][3].), their expected winnings, and their actual winning. After gathering all the necessary information together, I synthesized the coefficient of correlation (R) between the two arrays of data: expected wins versus real wins.
Surprising, the expected wins come very close to the teams’ actual record in real life! In fact, the largest deviations range between -7 games and +7 games as teams underperform or overperformed their expectations. The average deviation per team, surprisingly, cancels out to exactly 0 deviations as the two arrays of data pose a correlation coefficient of 0.960714. This R-value suggests an extremely strong positive correlation between the two arrays of data, thus indicating the Pythagorean Expected Win equation is indeed a highly accurate predictive tool.

Using this same predictive analytical tool, I thought that it would be cool to perhaps use it to predict the playoff!
By taking the average points scored and the average points allowed in the regular series by one team against its specific playoff opponents, we can compute that team’s expected winnings percentage in that specific playoff series. Using such percentage and multiply it by the 7 possible games, we can see which team has the upper edge.
Here is how I would interpret the result.
Due to NBA rule, if a team wins 4 games in a playoff series, they can advance to the next round. Thus, there are only 7 possible games that two teams could play with each other until one of them finally win all 4 given such binary condition.
Say, if a team is expected to win 1.9 games out of 7, this means that it will either gets swept (lost all 4 games in a row) or be defeated by the other team in game 6 (4 wins needed by the opponent plus the 1.9 win expected of the team). If a team is expected to win, let’s say, 5.59 games, it will also mean that specific team have a very high chance to sweep its opponent, or at least close out the series within 5 to 6 games.
Now here comes the hard part, if a team comes up with a 50-50 chance to win the game, or something around from 47%-53% of winning, I will create different alternate paths showing what would happen in each scenario. Doing this ensures we can see the whole potential picture and cover as much possible outcomes as possible. Doing this, we can also deduce a few teams that could potentially become the NBA champion.
Restrictions of this model
However, due to this simplistic model only using input from two different variables: points scored and point allowed in the regular series, and is solely based on the two teams’ previous matchup in the past, it fails to acknowledge the following potential factors that might completely change how the actual result will look like:
Personnel Change:
o It does not consider any roster changes, player injuries and coaching changes.
Playoff Intensity:
o Teams tend to play harder and more vigorously to win games during the playoff than they would in the regular seasons. This is due to players conserving their bodies and trying to not get injured during the regular season to prepare for the playoff.
Referee’s interference
I’m not claiming that the NBA is rigged, and that certain series are stretched out to bring in as much revenue as possible, or a team with a larger audience market could be favored sometimes, but just in case, this factor is also included.
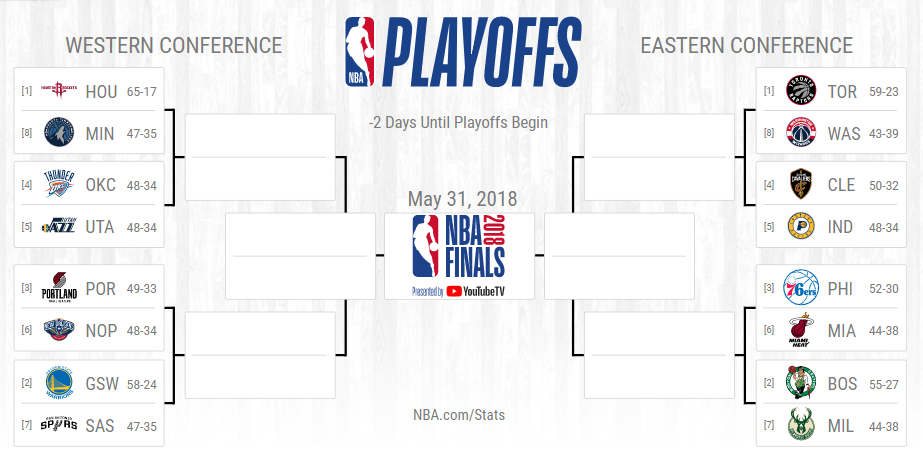
NBA Playoff Picture
Result
After applying the Pythagorean equation to different series, we arrive at this final playoff picture.

Note that any alternate path that is crossed out with a red cross means that route is now technically impossible due to that team already getting eliminated at the time of writing.
Analyzing this chart, we come at a several conclusions:
A star-studded Cavaliers led by Lebron might be possibly get eliminated by the Indiana Pacers.
Houston, due to their seeding position, will have to face two other stars-stacked teams including the Oklahoma City Thunders (that if they actually win against the Jazz, which at this point of me writing this, they look like they are going to lose) and the Golden State Warriors (already advanced in).
In the West, Oklahoma City Thunders (theoretically, even though the situation is not looking good for them right now), Golden State Warriors and Houston Rockets have equal chances of getting into the final.
In the East, it looks like the Toronto Raptors is expected to roll-over everyone (theoretically!) and get into the final. If they are matched up against Houston Rockets in the Final, the Raptors will have a surprisingly high chance of winning of winning the championship. This is due to the three past regular series match-up where the Raptor won two of by a significant margin.
However, we cannot disregard playoff LeBron James and best-record-this-season Houston Rockets
If Golden States Warriors get into the final, they are almost guaranteed to become the 2018 NBA Champion.
Thus, we deduce down to three potential NBA champions this season:
Houston Rockets, Golden State Warriors and Toronto Raptors

References
[1] https://en.wikipedia.org/wiki/Pythagorean_expectation
[2] https://stats.nba.com/teams/opponent/?sort=W&dir=-1&Season=2017-18&SeasonType=Regular%20Season
[3] https://stats.nba.com/teams/traditional/?sort=W_PCT&dir=-1&Season=2017-18&SeasonType=Regular%20Season


have my babies!!!!